Trump And Reagan County Comparison
2016 County Election
Recently, Mike Pence said that Donald Trump won more counties than any other presidential candidate than Ronald Reagan. Politifact claimed that this was mostly true. The question, I had was what was the margin of victory for Donald Trump compared to Ronald Reagan. The census provides some data for the 1984 campaign, the data is from Congressional Quarterly Press but hosted on the census website. Townhall.com provided the data for the 2016 election. Of course, the 2016 data is still going through some polishing, so these results are preliminary.
1984 Map
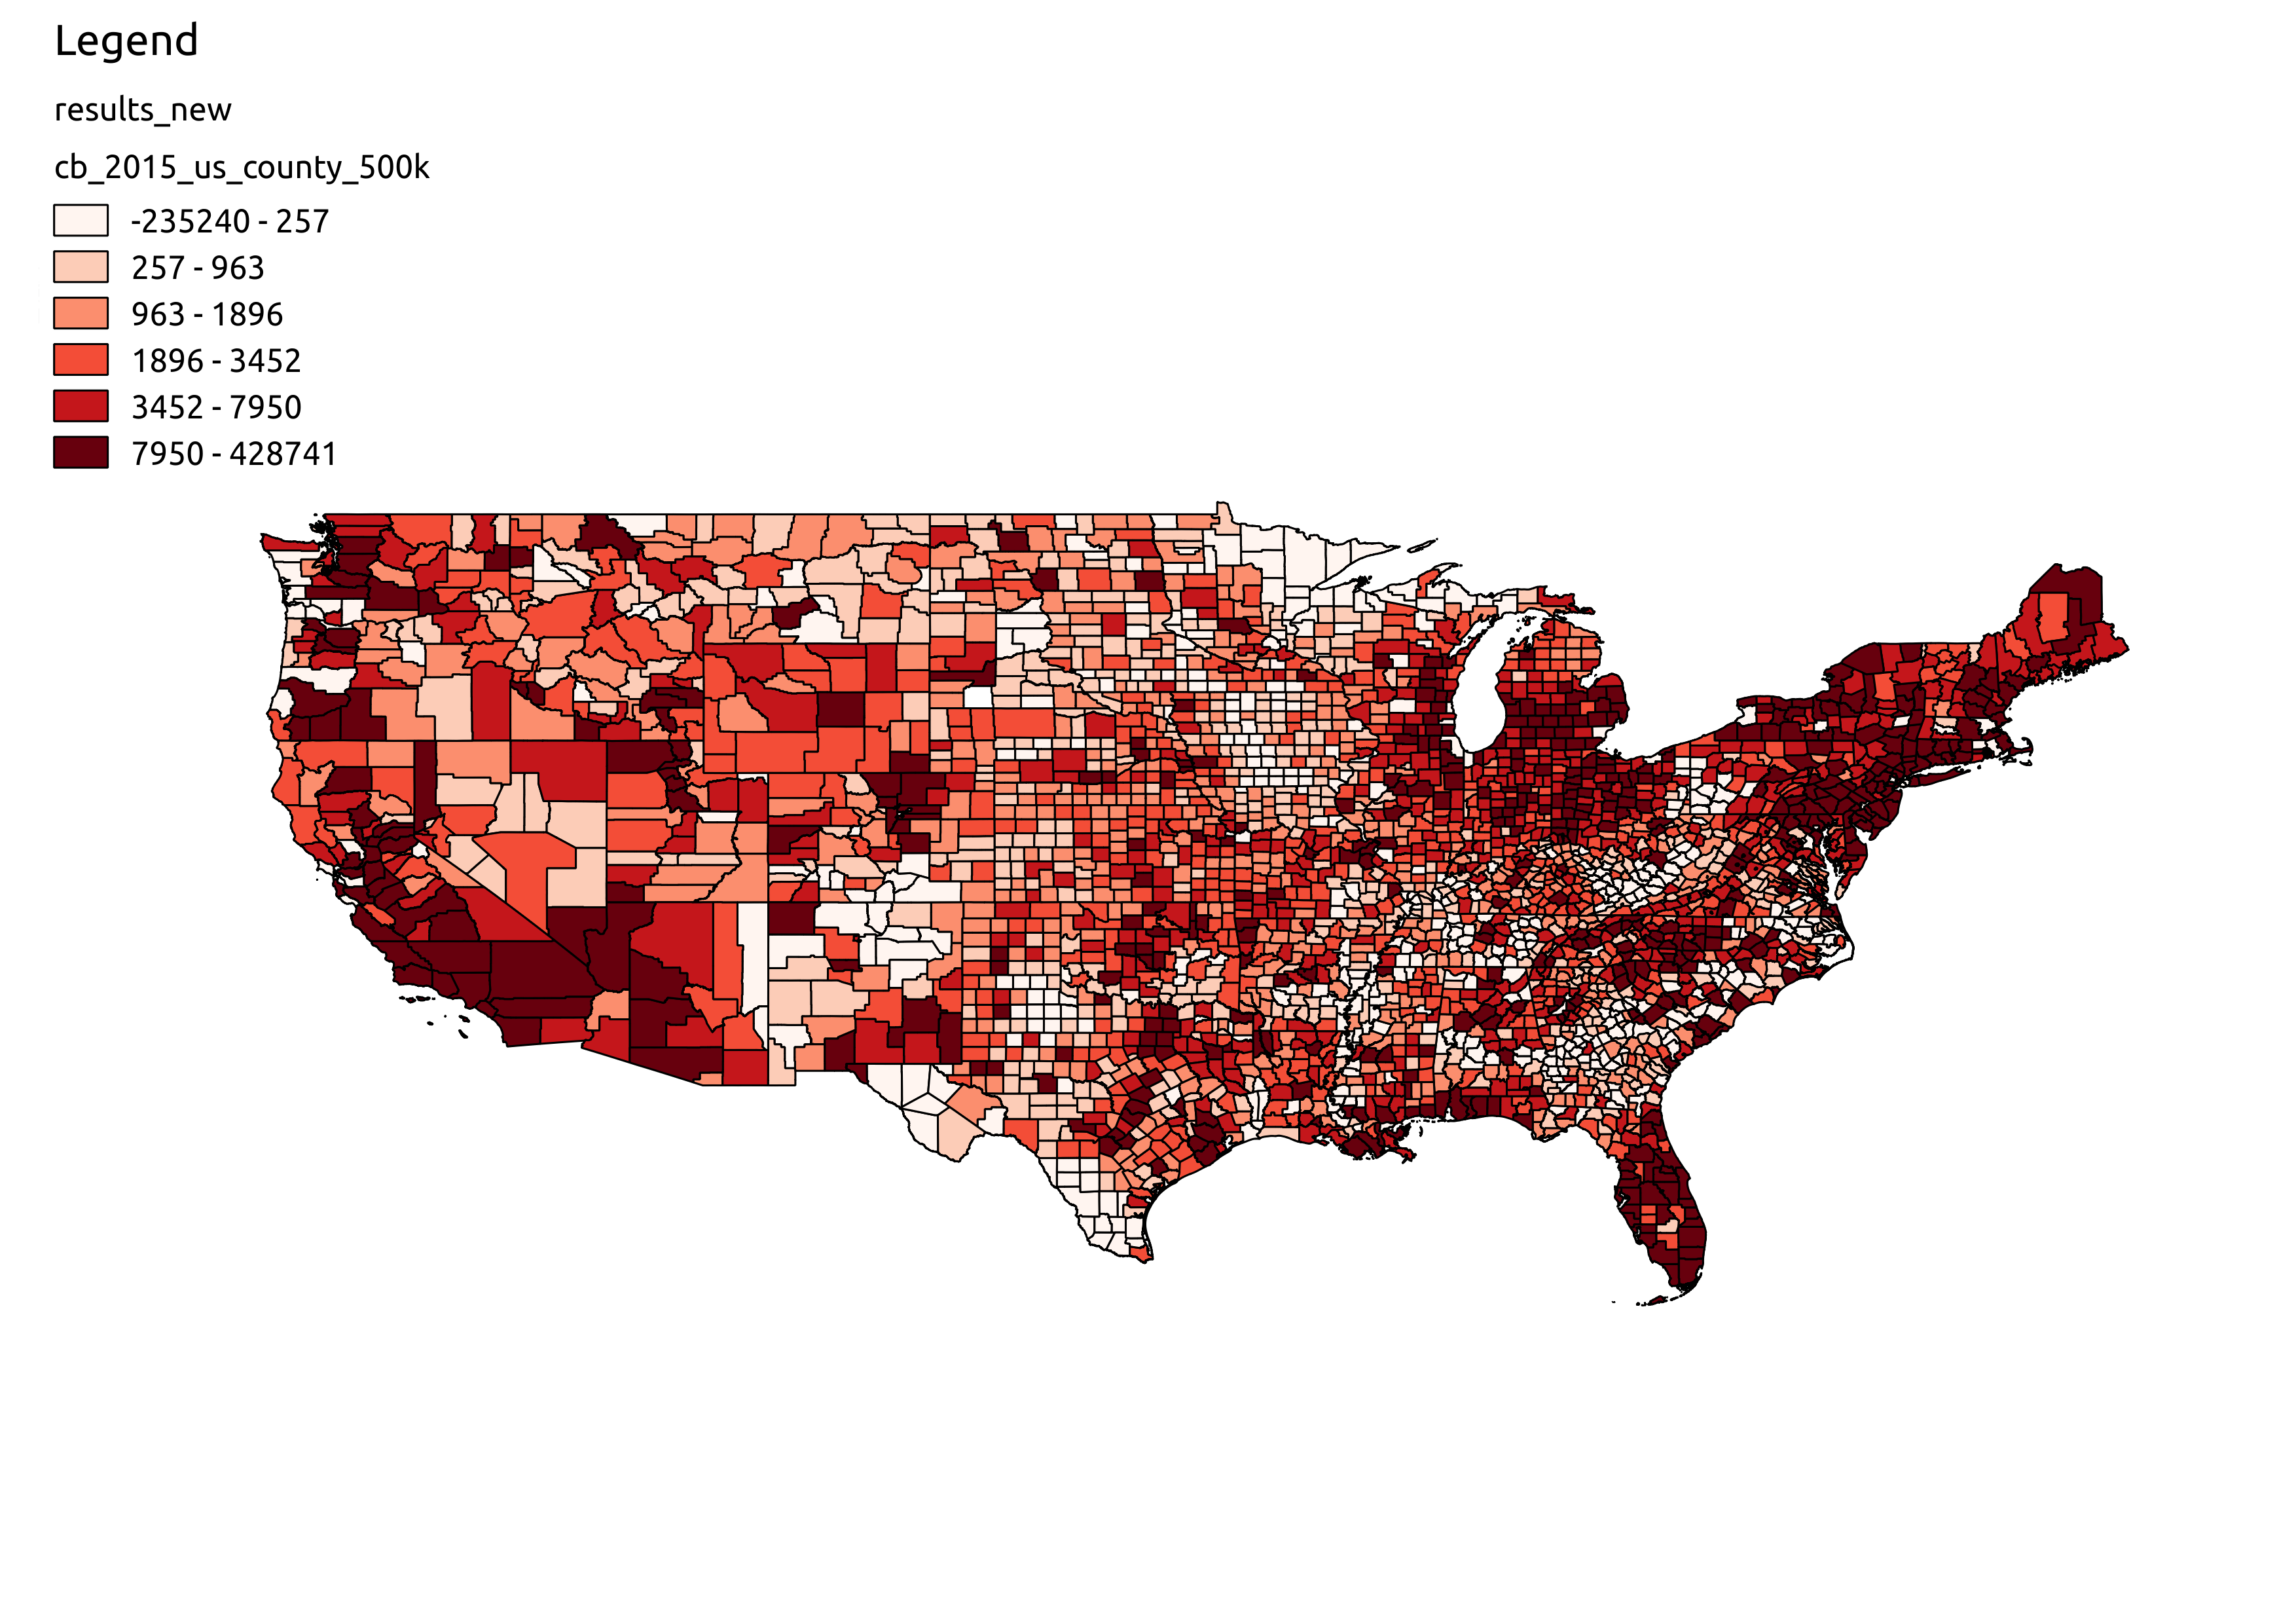
Ronald Reagan’s re-election campaign will provide the benchmark for comparing Donald Trump’s election. The reason for this is that 1984 he only lost Minnesota and the District of Columbia, so this is the highwater mark that Mike Pence cited in his comment. The map shows the relative margin of victory for Reagan computed by taking subtracting differences between the Republican candidate and the Democrat candidate. Below are the numerical results and then the maps. I removed Alaska from the totals becuase the state does not return county level election results.
| Election Year | Republican Candidate Votes | Democrat Candidate Votes | Difference |
|---|---|---|---|
| 1984 | 54310590 | 37511783 | 92434275 |
| 2016 | 60197788 | 60873946 | 127269327 |
This is what we expect, the Democrat in 2016 was a little ahead in the popular vote, no surprises. Below is a map of the county break down of the 1984 election.

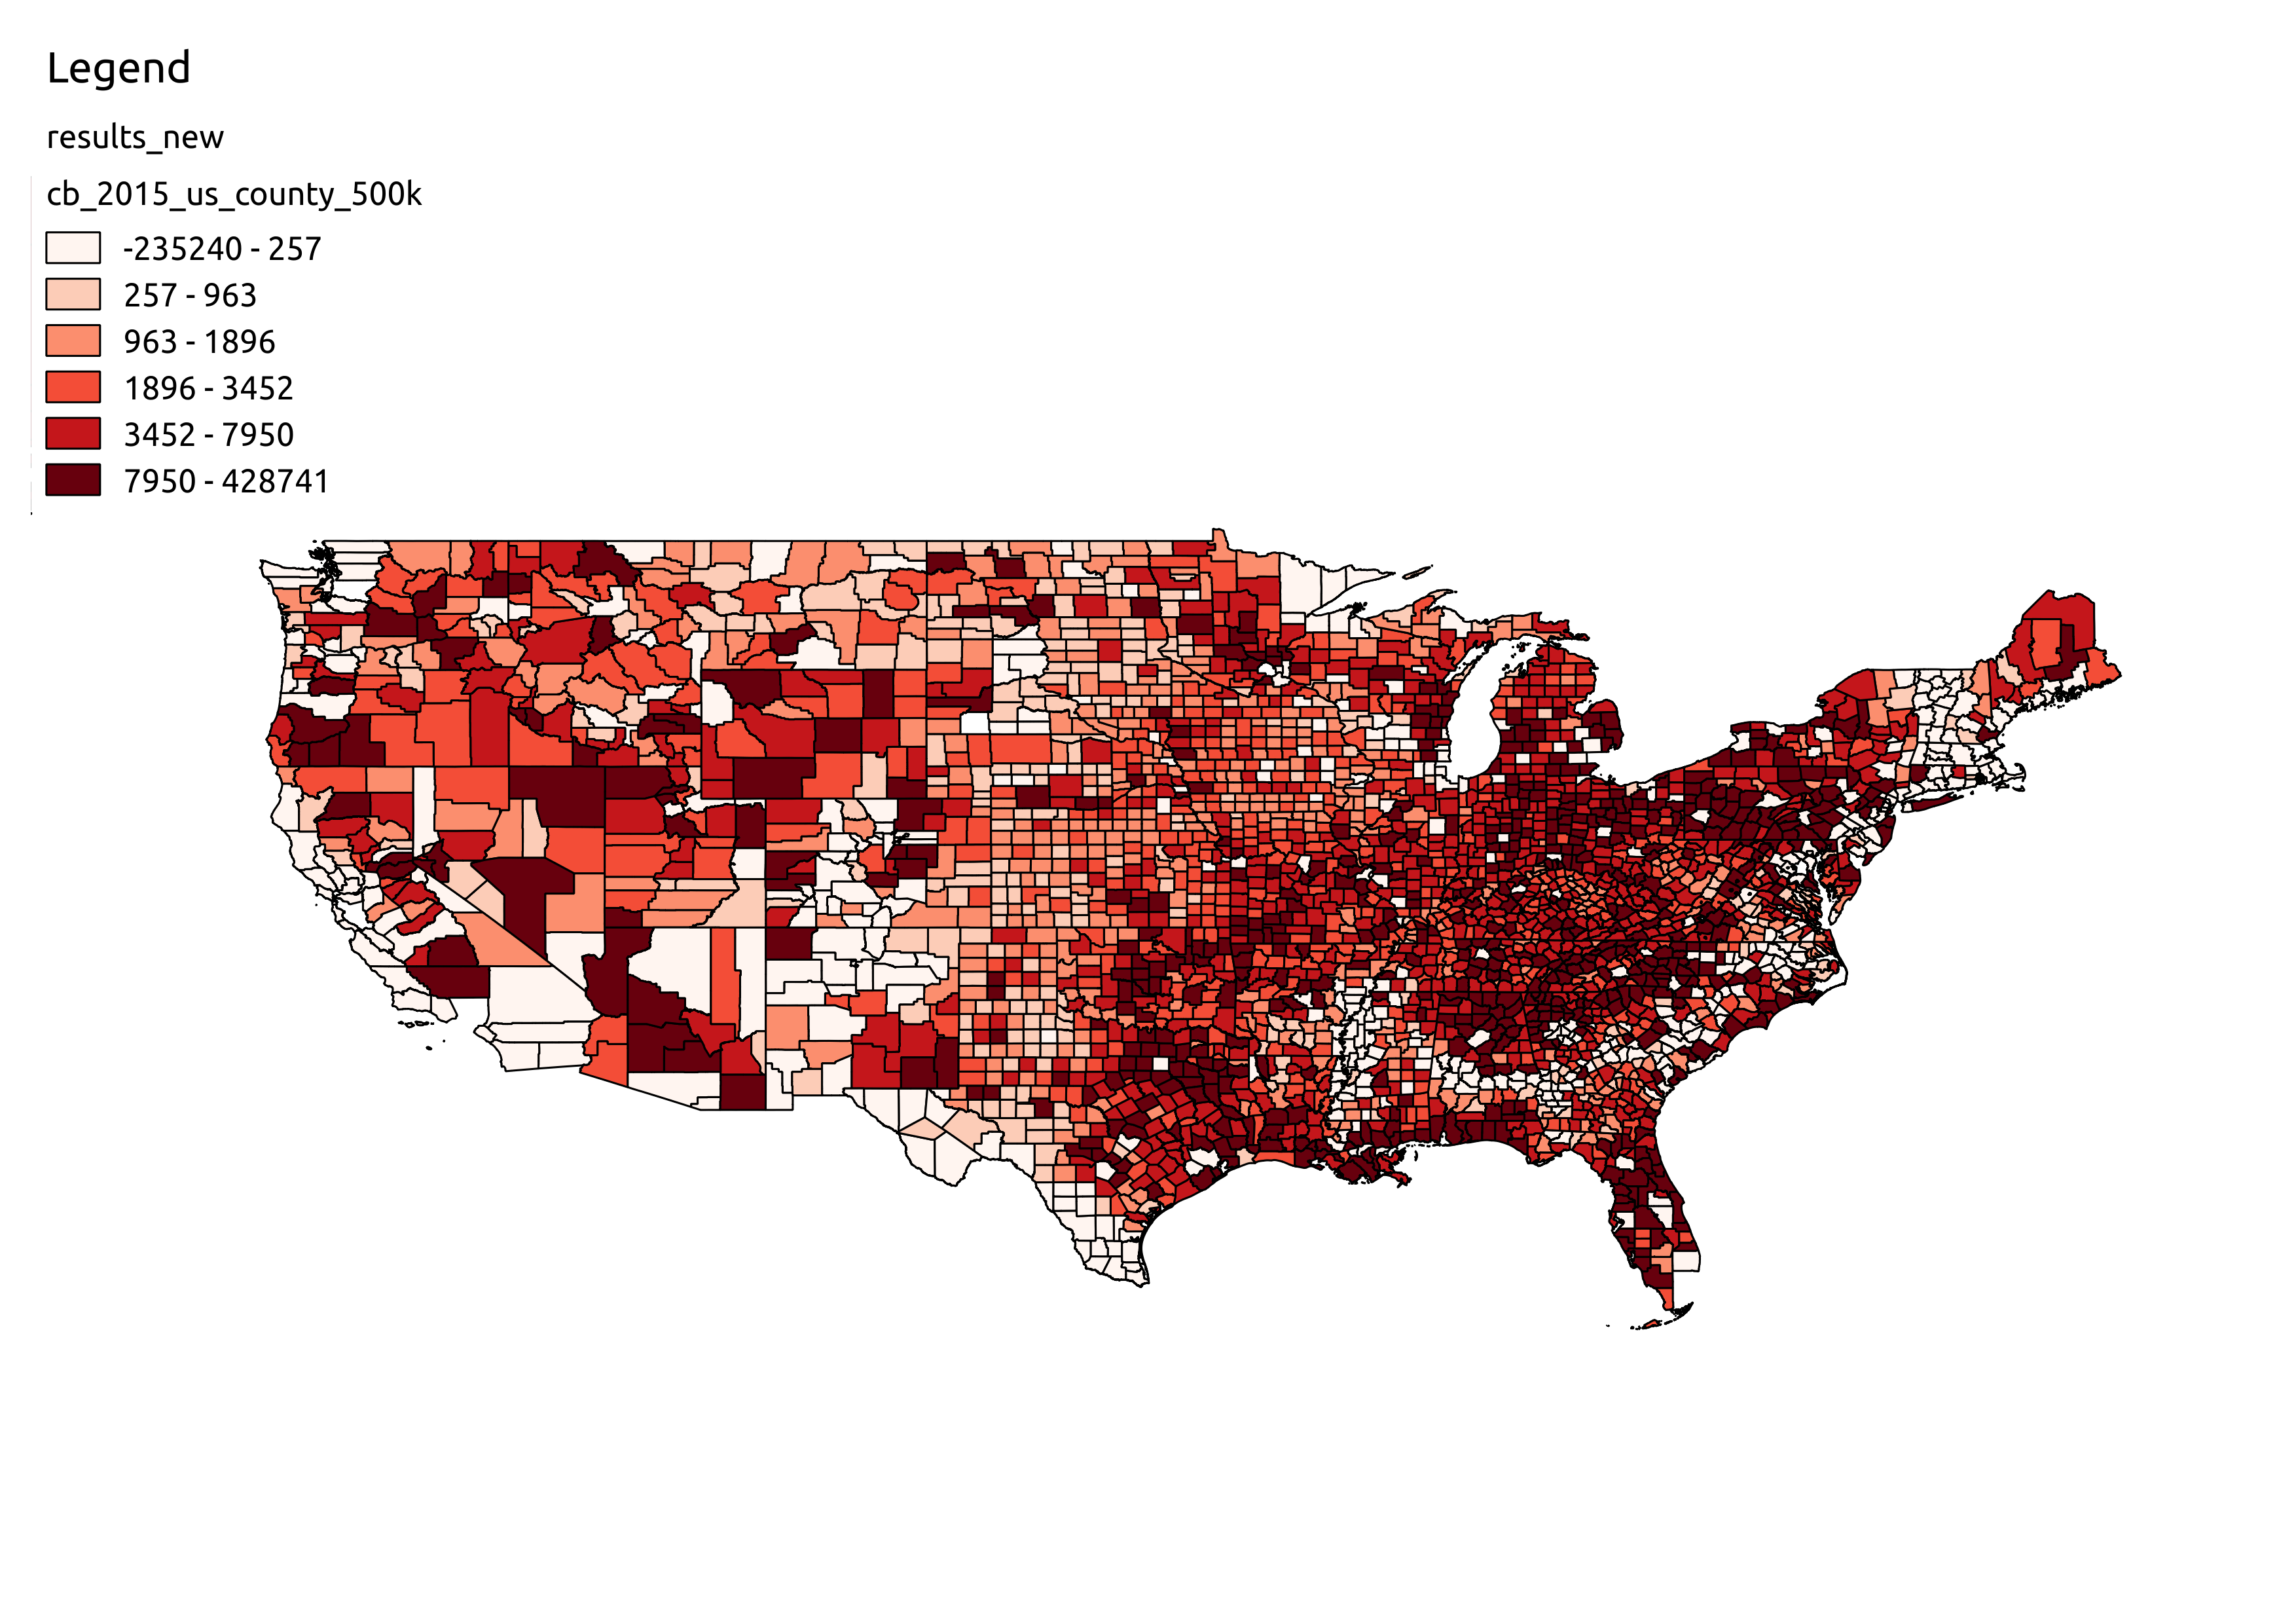
For 2016, things are a little bit different. The intense areas in the East and West coast are much less concentrated. However, note the intense red areas in the East and West Coast. The Ohio River valley is more uniformly red than it was in 1984, which is partly why Trump was able to win the election. The shifts show the changing party affiliation and how the Rockefeller Republicans are pretty much gone as an electoral force.

Nothing is very surprising, this is in line with what the national election showed. However, when we look at the margin of victory for Reagan and Trump, it shows the narrowness of the race in 2016. The table below shows the average margins of the candidates.
| Candidate | Average Margin of Victory by County |
|---|---|
| Reagan | 6980.8 |
| Mondale | 7768.5 |
| Trump | 6616.6 |
| Clinton | 37052.8 |
Although the margin of victory for Trump is less than the margin of victory that Reagan had when he won, Clinton’s margin of victory in the counties that she won is tremendous. This is indicative of the large urban concentration of Clinton support as well as the increasingly urban population concentration of voters.